The 🌟 SUPER POWER 🌟 of Lighting Controls
Using our zencontrol platform we can provide a range of software solutions with in-depth building analytics to increase the effectiveness of your building control.
With a zencontrol system, you can collect, analyse, store and transform data to understand the current performance of your building, track and monitor energy usage, and make changes to meet sustainability goals, improve well-being, and make informed maintenance decisions.
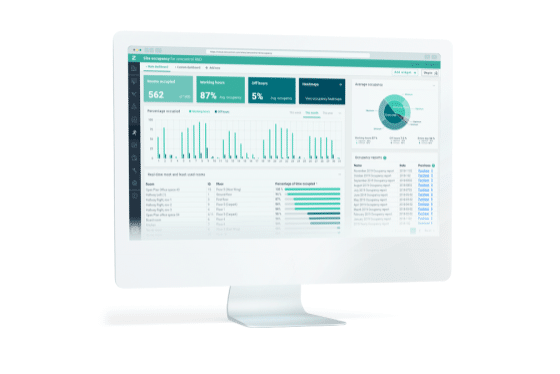
You can even customise your own dashboard to show graphs and widgets focussing on the areas important to you and your building.

When is lighting control, not JUST lighting control?
When it’s super power is a complete suite of building analytics!
🌐 Smart Building:
The evolution of building analytics via a zencontrol platform increases the value to stakeholders while minimising deployment costs as the data is made available on a standard DALI-2 (or DALI+) system.
The zencontrol analytics suite can process a wide variety of data with feedback via the lighting control as above.
With sensors able to measure occupancy (including people counting), temperature, humidity, air quality, and much more, a wide range of building analytics data is constantly being fed back through the software to measure performance, pinpoint issues, and allow analysis to make informed decisions regarding any proposed changes.
🚀 Wired or Wireless:
zencontrol supports wired (DALI-2) and wireless (DALI+) systems, with full wireless support of IEC62386-104 devices over UDP and Thread®. Customers experience the same features and benefits regardless of their choice of connection technology.
🛠️ Power Consumption:
To measure and analyse energy consumption in a building, zencontrol’s Power Analytics tracks all compliant DALI devices to provide accurate and encompassing data.
The Power Dashboard works out watts/m2 of the building using your building’s set-up.
You can even see the amount of eCO2 saved by energy-saving features deployed in the building, along with daily energy savings achieved by task-tuning, sensor placement, daylight harvesting, or other pro-active steps taken to reduce energy use.
The dashboard allows per fitting monitoring for lights, emergency fittings, switches, sensors and other DALI devices. View per fitting, per room, per floor, or department.
Identify high power usage areas and employ strategies to reduce power consumption.
Change your building control functionality to maximise energy savings and track power usage over time to see the effect such changes have made.
A cloud-connected API is provided to suit large scale BMS.
The system shows power data of external circuits through RTU power meters.
🌐 Building Health:
The Issues dashboard allows maintenance teams to quickly and accurately track the system performance with a wide range of reported issue types.
The building analytics software collects data from almost every device in the building in near real-time with a maximum latency of less than 10 minutes regardless of the building size.
With an understanding of how issues occur over time, maintenance departments can prioritise resources, and budget for repairs and capital costs. Spotting ‘trends’ can provide insight into product life cycles.
All reported issues and issue resolutions are recorded and automatically stored for future analysis. Data from issues is available both for download and for use in the creation of custom reports.
💰 Analytics Dashboard:
The analytics dashboard allows you to compare and analyse your site’s operation, understand the details, make changes and then validate the results.
Choose your data and chart type and compare on the same graph to better understand the information.
Select the dates and the intervals between when the data is calculated to best suit your requirements. Compare power usage for instance, with and without daylight harvesting.
Compare occupancy and arc levels in a room or area to evaluate the effectiveness of a sensor or sequence. Sequences can then be optimised to reduce power or nuisance dimming.
By saving and comparing the building analytics data before and after a change, differences can be evaluated and actual savings validated.
Track and understand the reason behind changes and gain an accurate grasp of the predicted vs actual payback time.
-
-
- See when a fitting is replaced
- See time until payback
- Estimate payback rate
-
Fully understand the lifetime of a manufacturer’s products via product tracking and statistics.
Lifetime tracking allows a building owner or facility manager to see which brands are performing better, and living up to the manufacturer’s promise.
Use analytics to visualise and interact with your devices on Plan View. Quickly and easily identify faults, power usage and high/low occupancy.


