Building Control Analytics
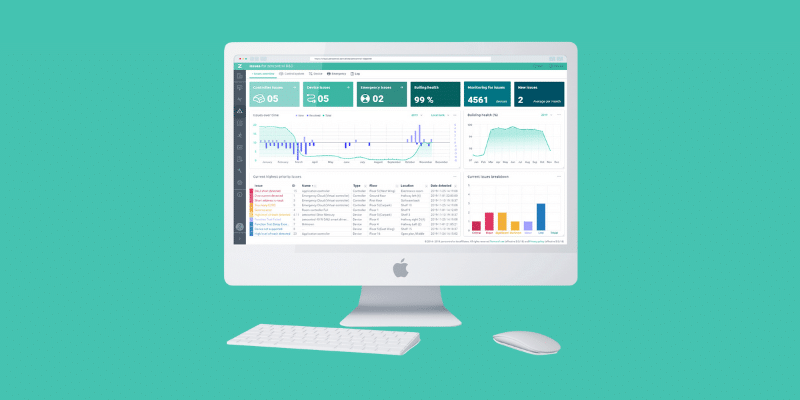
We have a range of building control analytics software solutions to measure, monitor and report on the effectiveness of your building control. Speak to us about options to meet your needs.

Plan View
Plan view software enables the facility manager or maintenance personnel to quickly and easily obtain a visual overview of the site to enable:
- Easy identification of fault locations;
- Swift resolution of maintenance issues/repairs;
- Status of current lighting levels across the facility;
- Changes to schedules, light levels and more.
Read more about Plan View.
Power Usage Mapping
When power usage mapping is available as part of your building control system, facility managers can understand the power usage of the building’s lighting without expensive circuit monitoring.
Power usage mapping provides the necessary building control analytics to:
- Identify per fitting, per room, per floor or by department;
- Track power usage over time to identify effectiveness of power saving plans;
- Spotlight high power consumption areas;
- Employ strategies to reduce power consumption;
- Change building control to maximise energy savings.
Lux Level Mapping
Traditionally, measuring of lux levels, and accurate setting up of daylight harvesting has relied on personnel using portable lux meters, taking many manual readings around the building.
The new technology that we employ makes it simple to map lux levels for accurate building control.
Lifetime Tracking
A popular feature of our analytics software is the ability to provide full lifetime asset tracking and statistics to provide a comprehensive picture of the lifetime of a manufacturer’s products.
Lifetime tracking allows building owners to see which brands are performing well, and to identify those that are not living up to their manufacturer’s promise.
Payback Tracking
Similarly, our software can assist you to understand and track your lighting changes and get accurate statistics to confirm the actual payback time (predicted vs actual).
You will see when a fitting is replaced, see time until payback, and receive an estimated payback rate.
Occupancy Use Mapping
Visual reports show area utilisation and allow facility manager to better understand their building usage.
Occupancy maps can help the manager:
- Understand when and why resources become over booked;
- Determine main movement pathways and identify critical areas for maintenance;
- Schedule maintenance based on degree of use;
- Prioritise maintenance and upgrade works based on risk;
- Change lighting control based on use to schieve maximum energy savings;
- Identify which rooms and areas have the highest utilisation, and reconfigure the building control accordingly;
- Drill down to get occupancy mapping per light fitting when required.


